In the forex and crypto markets, investors make money by buying and selling different financial assets. If an asset is expected to gain in value, money is made out of buying the underlying asset; if the asset is expected to fall in value, money is made out of selling. This is fairly straightforward – but the daunting part is determining when to buy, and when to sell. This is where analysis comes in. There are two main methods investors utilize to analyze the current and potential future prices of different financial assets: technical analysis and fundamental analysis.
Technical Analysis
Technical analysis involves forecasting the potential future price behavior of financial assets based on historical price action. Technical analysis is founded on the belief that history repeats itself. Technical analysis believes that within the randomness or chaotic movement of an asset’s price, actionable patterns may be found that will make it easy for investors to predict future price action. Technical analysts believe in the transparency of price – that all factors known to the market, at any given time, are discounted on the prevailing price. For this reason, the most important parameters for technical analysts are price and time. To allow for effective analysis of financial assets, technicians utilize two main tools: charts and indicators.
Forex Charts
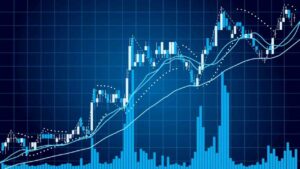
Charts are the foundation of technical analysis because they present a graphical depiction of the price behavior of assets over a period of time. When watching a chart, technical analysts look at price and time. While the price is constant, investors can always change timeframes within which they wish to watch the movement of the prices of their favorite financial assets. Usually, investors with short term outlooks watch chart timeframes such as 5-minutes, 30-minutes and 1-hour, whereas long term technicians may watch daily, weekly or monthly chart timeframes.
A quick look at a forex chart should let an investor know whether the price of an underlying financial asset is ranging (moving horizontally) or trending (moving up or down).
There are 3 types of charts mostly utilized by forex traders:
- Tick Charts
While all other charts are time-based (printing bars after a preset time period has elapsed), tick charts are activity-based. This means that bars are printed after a particular number of trades have been completed in the market. Tick charts are utilized by advanced, professional investors who seek to aggressively take advantage of very short term (sometimes seconds) trade opportunities in the market.
- Line Charts
Line charts have been around probably since the invention of technical analysis and are still popular to date. They are usually drawn by connecting the closing prices of underlying financial assets over a predetermined period of time. Line charts are still popular because of their simplicity. On a line chart, investors can easily watch the behavior of an asset’s price and mark out definitive support and resistance levels in the market.
- Candlestick Charts
Candlestick charts are now pretty much the standard on most forex platforms. Like line charts, they are also time-based; but unlike line charts, they provide much more comprehensive price information on a particular financial asset over a selected period of time. In addition to closing prices, candlesticks also show open, high and low prices of financial assets on every bar printed on the chart. Furthermore, candlesticks are graphically appealing, and they make asset price analysis simple and exciting for investors. In fact, some investors just watch candlesticks exclusively to determine whether to buy or sell any asset in the market.
Indicators
Indicators are mathematical tools that help traders perform efficient technical analysis on the prices of their favorite financial assets. When used efficiently, indicators give meaning to the current price action and enable investors to identify the most optimal entry and exit points in the market.
Here are the main types of indicators used by forex traders:
- Trend Indicators
The purpose of these indicators is to help traders to exploit the best trading opportunities in trending markets. Trend indicators allow traders to place the best trades that are in tandem with the prevailing trend in the market. Some of the popular trend indicators include Moving Averages and Ichimoku Kinko Hyo.
- Volatility Indicators
Volatility indicators help investors to identify high and low volatile assets. Volatility refers to the severity and frequency of price changes in the market. Highly volatile assets print the widest ranges in any particular trading session, whereas low volatile assets print narrow ranges. Volatility indicators thus help traders filter out assets they wish to trade in any trading session as well as the appropriate capital amounts to stake in different markets. Some of the popular volatility indicators include the Average True Range (ATR) and Bollinger Bands.
- Momentum Indicators
These indicators essentially measure the momentum of an asset’s price. They are also known as Oscillators, and they help in determining overbought and oversold conditions in the market. Basically, traders look for buy opportunities in oversold markets; and sell opportunities in overbought markets. Oscillators are very popular indicators and examples include the RSI and Stochastics.
- Volume Indicators
These indicators help investors to measure the volume behind any particular movement of price in the market. They essentially help establish whether price movements are backed by real conviction or otherwise. This can help confirm trends and reversals, as well as spot potentially fake setups in the market. Volumes and Money Force Index (MFI) are some of the most popular indicators in this group.
- Market Cycles Indicators
Market cycles indicators help traders read the overall sentiment of market participants as well as establish the different phases of price development at any given time. Prices usually rise and peak, then fall and bottom out, continuously. With these indicators, investors can tell the prevailing phase of price development and anticipate the succeeding phases. Examples of market cycles indicators include Elliot Waves and Gann Cycles.
Why You Should Learn Technical Analysis
Here is why you should strive to learn as much as you can about technical analysis:
- Identify prevailing market conditions. By establishing whether a market is going up, down or sideways, technical analysis helps traders apply the appropriate strategies in appropriate market conditions.
- Timing trades. Technical analysis enables investors to time the most optimal entry and exit points, where there is minimal exposure to risk and a high potential for maximum profits.
- Ideal in short term trades. Technical analysis is the most convenient method for picking out the best trading opportunities in short chart timeframes.
- Various Assets. Technical analysis can be applied to all types of financial assets to trade both short- and long-term opportunities.
- Pending orders. Technical analysis can help traders take maximum advantage of pending orders such as buy/sell limits and buy/sell stops. It also helps in placing ideal stop loss and take profit price points.
Access free forex lessons on technical analysis and build your trading skills and techniques!
START LEARNING HOW TO TRADE FOREX FOR FREE
Fundamental Analysis
Fundamental analysis involves analyzing all the economic, social and political factors that affect the supply and demand of any particular financial asset. Just like in any market, the prices of financial assets are determined by the forces of demand and supply. The aim of fundamental analysis is to establish the fair market value of any particular financial asset. This value is then compared to the current market price, with the financial asset then deemed either undervalued or overvalued. Traders go long on undervalued assets and go short on overvalued assets. The objective is to ride the price of any particular financial asset until it is as close as possible to its fair market value. Fundamental analysts are not bothered by short term price fluctuations and are more likely to take long term positional plays in the market. When utilizing technical analysis, traders are more concerned with ‘when’ the price will move, but fundamental analysts are more concerned about ‘why’ the price moves.
Fundamental analysis is always considered a preserve of the advanced or more elite investors, with most retail traders exclusively utilizing technical methods to analyze the prices of the favorite financial assets. However, it is important to understand the basic fundamental qualities of an asset you are trading even if you intend to predominantly utilize technical analysis in your strategies.
Variety of Assets
The type of financial asset will determine the fundamental factors investors must consider before placing a trade. For stocks, fundamental factors include corporate and earnings reports and the overall underlying economic conditions. For commodities, investors may look at the value of the US dollar (USD) in addition to prevailing market forces of demand and supply. In Forex, investors may look at major events, such as interest rates, which directly impact on the demand and supply of individual local currencies. Both quantitative and qualitative fundamental factors are taken into account when valuing an asset. Quantitative fundamentals constitute hard facts and accurate numbers, such as revenue or profits, whereas qualitative fundamentals are influential intangibles, such as proprietary technology or brand name.
For fundamental analysts, data is the most important ingredient for price analysis. In an interconnected world, investors now have access to numerous pieces of information all around the internet. It is, however, especially important to only consider the relevant pieces of data that have an actual impact on the demand or supply of an underlying financial asset.
The Economic Calendar
As mentioned above, data is particularly important to fundamental analysts. This is why the economic calendar is probably the most important tool in fundamental analysis. The tool makes it easy for investors to track the release of all relevant data that may have an impact on the prices of various underlying financial assets. The economic calendar presents the schedule of the most relevant data and events that may have an impact on underlying financial assets. Traders are shown which news events are relevant to any financial asset and the expected degree of impact their release may have on its prices. On broker sites or financial sites, the impact is listed as either high, medium or low. While all data pieces are important, investors focus more on those that are likely to have a high impact on the prices of an underlying asset.
The economic calendar makes it easy for any investor to incorporate fundamental analysis into their strategies, especially news-based trading strategies. The actual release of data or events is updated in real-time, and investors can use the new information to take advantage of potential price changes. Alongside the current actual data release, the economic calendar also displays the previous reading as well as overall expert and market expectations. This is important because raw data is not the only catalyst of price movement in the market. It is not uncommon for prices not to go in tandem with the released data. That is, prices may sometimes dip on positive news. This means that it is important to take into account the expected reading, which serves as a general barometer of market sentiment on an underlying asset ahead of the release of any relevant fundamental data. For instance, a positive reading may not trigger higher prices in an underlying asset if that was what the market expected, because the expectation was already discounted in the prevailing price. But if the actual reading exceeds or fails to meet expectations, big price movements may be triggered.
Here are some of the most important data forex traders look out for when trading their favorite assets:
- Interest Rates
Currency pairs are the most traded financial assets in the forex market, and in particular, the US dollar accounts for the bulk of transactions executed. Interest rates are the biggest source of supply and demand in local currencies. Higher interest rates fuel the demand of the local currency, which strengthens its value; whereas lower interest rates increase the supply of the local currency, which consequently weakens its value. For instance, if the US Federal Reserve decides to hike its base interest rates, EURUSD traders may take advantage by selling the currency pair.
- GDP
The Gross Domestic Product (GDP) is one of the most influential economic indicators. It represents the value of all goods and services produced by a country’s economy. Positive numbers usually inspire demand for the local currency, whereas negative numbers denote a weakening economy and they inspire selloff of the local currency.
- Consumer Price Index (CPI)
CPI is the most important inflation indicator in any country. The index measures the change in the prices of a basket of important market goods. This information helps underlying central banks to track the potential risk of inflation in their local economies. If there is evidence of inflation or lack thereof, the underlying central bank may decide to hike or cut rates accordingly.
- Employment Number
Employment figures are widely watched by the markets, with the US NFP (non-farm payrolls) probably the most followed single fundamental news among forex traders. Positive employment numbers denote a healthy economy and inspire the demand of the local currency, whereas negative figures imply a weakening economy, and this may trigger a selloff of the local currency.
CLICK HERE TO ACCESS MORE FOREX LESSONS ON FUNDAMENTAL ANALYSIS. Ensure you are always on top of the market!
Combining Technical and Fundamental Analysis
While traders may find success using the two methods exclusively, it is prudent to combine them into a holistic strategy that will maximize profits in the market while minimizing risk exposure. This is because both methods have inherent limitations that can be eliminated when traders combine the two modes of analysis. For instance, technical analysis tends to lag on the price because it is largely based on history. This means that traders may be acting on late or sometimes irrelevant trading signals. On the other hand, fundamental analysis may be deemed irrelevant because most of the information out there is already priced in the market. Individual assets require individual fundamental analysis, unlike in technical analysis where the methodology is uniform across all assets. Furthermore, fundamental analysis does not provide specific entry and exit price points, which may ultimately limit profitability.
In light of this, it makes a lot of sense combining both methods so as to enhance their collective efficiency while curbing their individual limitations. To start with, traders may use fundamental analysis to develop a directional bias in a market and apply technical analysis to identify the most optimal entry and exit points in the market. While fundamental analysts are not overly concerned with short term fluctuations in the market, they will still appreciate getting a good entry and exit price when trading their favorite financial assets. Similarly, technical analysts will enjoy trading in the direction of fundamental bias even though they hold short term positions in the market.
Fundamental analysis can also help in determining which markets to trade, after which traders can apply technical strategies to take maximum advantage of lucrative trade opportunities. For instance, if the US NFP report shows a positive number, the US dollar will be expected to increase in value. With this in mind, a EURUSD trader will only seek opportunities to place sell orders in the market with the expectation that the US dollar will strengthen relative to the Euro.
All in all, both technical and fundamental analysis methods can help traders identify tradable opportunities in the market. Traders can further enhance their trading activity by employing both methods, which will ensure that they exploit the best trading opportunities in the market with minimal risk exposure and maximum potential profitability. For any beginner, learning and implementing both methods will definitely give you a competitive edge in the forex and crypto markets.
Complete your technical and fundamental analysis lessons and start trading with the best forex brokers!
SIGN UP WITH A TOP BROKER NOW

- How to Make Money Trading Forex with No Previous Experience - September 23, 2020
- Free Trading Training – Master the Online Trading World - September 22, 2020
- How Much Money Do Forex Traders Make Per Day? - September 22, 2020