Popular Forex Technical Indicators
Support and Resistance Levels
It is crucial to explore the definition of support and resistance levels provided by technical analysts themselves. According to a respected technical analysis manual, “support is a level or area on the chart under the market where buying interest is sufficiently strong to overcome selling pressure. As a result, a decline is halted, and prices turn back again. . . . Resistance is the opposite of support.”
Knowing where a currency price may stop and turn around helps you to enter and exit your investments at the most profitable times.
Support is a price level at which a currency pair tends to stop moving down, then turns around and starts climbing. Support and resistance levels illustrate significant psychological levels. Support and resistance are reversible depending on the current price and trend.
Support and resistance levels are not precise. Instead, they are general price ranges. When you are identifying your support and resistance levels, picture yourself drawing them in with a large marker instead of a fine-tipped pen
Support and resistance levels form as prices rise or fall to the same levels time and time again. You can see these support and resistance levels take shape on charts of the stocks and CFDs you are interested in trading as the price moves back and forth.
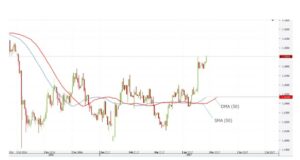
Moving Averages
A moving average is one of the simplest and most popular indicators that traders use. The aim is to filter out ‘noise’ by smoothing short-term fluctuations in price action. A moving average is a lagging indicator – it is good at showing a trend, but signals tend to be given after a change in the price action.
There are three major types of moving average – the Simple, the Weighted, and the Exponential. These vary in their construction and tend to produce differing results using the same inputs, but their purpose is the same.
Time frames for moving averages vary and can be based on hours, days, weeks, or even years. Intervals can also be changed, depending on the type of security being traded and the approach of the trader. For example, trading 10 period and 30-period averages are typical.
Normally Moving Averages use the close price but it is possible to use open, high, low, as the basis for the average.
In addition to providing trading signals, averages can act as support and resistance levels when determining price targets.
Moving averages are useful in viewing trends and revealing potential reversals. A market that is above its moving average is said to be in a rising trend. One that is below its moving average may be said to be in a downtrend. Sideways trends can be identified when a market moves either side of a moving average.
RSI & Stochastics
The Relative Strength Index (RSI) is one of the simplest ways to gauge momentum. Developed by J. Welles Wilder in the 1970s, it’s based on the simple notion that prices will tend to close higher in an uptrend and close lower in a downtrend.
RSI is built by comparing the average up-day gains and down-day average losses over a given time period , usually 14 days. For less volatile markets a shorter period may be appropriate.
The number read is between 0 and 100. Rising markets will yield readings closer to 100 while falling markets will yield readings closer to zero.
Stochastics is a momentum indicator that shows where the most recent closing price fits concerning the price range over a predetermined number of days, usually 14. Stochastics is based on the premise that prices tend to close near highs in an uptrend and near its lows when prices are trending lower.
On divergence a signal of inversion is given. For example, if the market continues to make new highs but prices tend to settle down at the lows of the day, it can foreshadow an uptrend reversal. From a logical point of view, this makes sense as if prices can not settle at the day’s highs, and it suggests buyers lose interest and earn profits sooner.
MACD – Moving Average Convergence & Divergence
MACD – is one of the most popular tools for traders. It incorporates trend following and momentum characteristics.
This indicator shows the relationship between two moving averages to identify changes in market trends.
The MACD line shows the difference between two exponential moving averages (EMAs). Usually, this involves subtracting the 26-day EMA from the 12-day EMA.
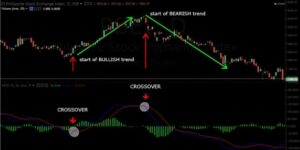
A nine-day EMA of the MACD line is the third element, and this is known as the signal or trigger line When the two lines cross, it is a signal that a change in trend is happening.
When adding your MACD indicator to your chart, you have the option of defining these moving averages according to your own desired time frames; however, most people stick to the 26-12-9
Divergence
If the security price diverges from the MACD, it can indicate the end of the current trend. For example, if the currency pair keeps rising and the MACD line starts falling, it could mean the rally is about to end.
This does not need to mean all-time highs and lows. Typically, a bullish divergence can occur when the security falls to a new reaction low, and the MACD line fails to follow suit and sets higher lows.
Centerline crossover
A centerline crossover occurs when the MACD Line moves either above the zero line to turn positive or below to turn negative. A bullish centerline crossover occurs when the 12-day EMA of the security moves above the 26-day EMA. A bearish crossover occurs when the 12-day EMA moves below the 26-day EMA.
Signal line crossover
This type of crossover occurs when the MACD line crosses the red signal/trigger line. A bullish crossover occurs when the MACD rises above the signal line. A bearish crossover occurs when the MACD turns down to cross below the signal line.

- How to Make Money Trading Forex with No Previous Experience - September 23, 2020
- Free Trading Training – Master the Online Trading World - September 22, 2020
- How Much Money Do Forex Traders Make Per Day? - September 22, 2020