Introduction to Technical Analysis
Technical analysis is the study of past patterns of price action in an attempt to determine a likely outcome of the future price move. Those studying the technical analysis are called Technical Analysts or Technicians. These analysts are not concerned with the intrinsic value of one currency as compared to another, but focus on the study of market movements only.
Technical analysis is based on the theory that the markets are chaotic but at the same time, price action is not entirely random. In other words, mathematical Chaos Theory proves that within a state of chaos, there are identifiable patterns that tend to repeat.
This type of chaotic behavior is observed in nature in the form of weather forecasts. For example, most traders will admit that there are no certainties when it comes to predicting exact price movements.
As a result, successful trading is not about being right or wrong: it’s all about determining probabilities and taking trades when the odds are in your favor. Part of deciding chances involves forecasting market direction, and when/where to enter into a position, but equally important is determining your risk-to-reward ratio.
Well, that is the complicated explanation; in reality, technical analysis is anything and everything we do with charts. It could be simply called chart analysis.
Charts and Analysis
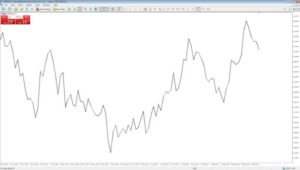
Line Chart
This chart is the simplest and doesn’t give much information. A line chart just has a line drawn from one closing price to the next closing price. So, all you see in a line chart is a series of closing prices.
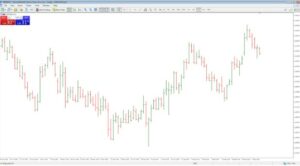
Bar Chart
A chart is a graphical representation of historical prices. The most common chart types are bar charts and candlestick charts. Although these two chart types look quite different, they are remarkably similar in the information they provide.
A bar chart reveals slightly more information than the line chart. You see both closing and opening prices in a bar chart. So, if you look at a 1-hour chart, each bar represents 1 hour. A bar in a 1-hour bar chart shows the price it opened within that hour and the closing price of that hour. In addition to that, it also shows the highest and the lowest prices of that hour.
Bar and candlestick charts are separated into different timeframes. Each bar or candlesticks represent the high, low open, and close price for a specific period.
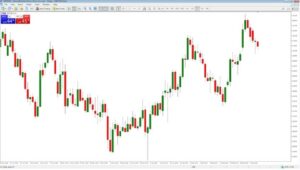
Candlestick Chart
In forex trading, candlestick charts have become the most popular. Candlestick charts offer everything bar charts do and more; using them is a win-win situation because you can use all the trading signals typically used on bar charts with the added clarity and additional signals generated by candlesticks.
There is a big difference between candlestick charts and using candlesticks to make trades. Reading candlesticks and understanding candlestick patterns is a bit more complicated
Candlestick charts have enjoyed continued use among traders because of the wide range of trading information they offer, along with a design that makes them easy to read and interpret.
This centuries-old charting style was developed in the rice markets of Japan. The style’s name refers to the way a rectangle represents each period, with lines coming out of the top and the bottom. This shape resembles a candle with a wick. The Japanese market watchers who used this style referred to the wick-like lines as shadows.
On the chart, each candlestick indicates the open, high, low, and close price for the time frame the trader has chosen. For example, if the trader sets the time frame to five minutes, a new candlestick will be created every five minutes. For an intraday chart like this one, the open and close prices are those for the beginning and end of the five minutes, not the trading session.
The area between the open and the close prices of a period is known as the body. The projections outside the body of the candle at the top and the bottom are called ‘shadows or wicks.”
With default settings, a candle may be either filled with white/black or red/green color or unfilled and hollow.
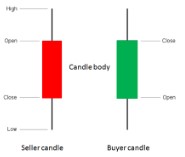
Bearish Candle
A filled candle just means that that the opening price is higher than the closing price. In other words, the price has come down in that specific period. This is also known as a bearish candle. A downward movement is also known as a bearish move.
Bullish candle
A hollow, unfilled candle means that the closing price is higher than the opening price. In other words, the price has gone up in that specific period. This is also known as the bullish candle. An upward movement in the Forex is known as a bullish move.

- How to Make Money Trading Forex with No Previous Experience - September 23, 2020
- Free Trading Training – Master the Online Trading World - September 22, 2020
- How Much Money Do Forex Traders Make Per Day? - September 22, 2020